
19 Mar 2014 Analysing indirect spend – the direct way to increase profits – part 1
Today we are please to publish the first in a short series from Michael Wydra of REL, part of the Hackett Group
Cutting costs is a recurring and sometimes even a permanent imperative in most companies. But when firms need to slim down, their efforts usually focus on reducing direct expenditures, even though indirect spend areas provide higher improvement potential that is often easier to realise.
“Indirect” spend covers goods and services that are not used in the manufacturing of an end product or development service. This area is often referred to as “nonstrategic” spend, since it has low strategic relevance. Indirect categories include office products, travel, car hire, waste management, energy, facility management, security services, insurances, telecommunications, IT, packaging, and maintenance, repair and operations (MRO) items. Because these areas are not always covered by central procurement, they may not be managed in a professional manner, resulting in a lack of visibility and control. However, these expenditures can add up to large amounts, making indirect spend worth a closer look.
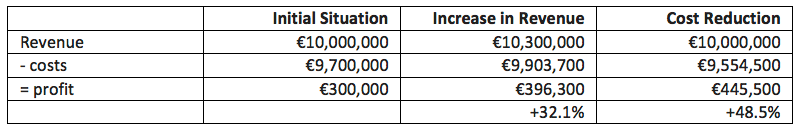
A cost reduction on spend can have a greater impact on profit than an equivalent increase in revenue. Figure 1 shows a comparison between the net profits from a cost reduction of 3 percent and from a revenue increase of 3 percent.
Figure 1: Hypothetical profits resulting from an increase in revenue and an identical reduction in costs
Managing indirect spend in a professional way has a major impact on the health of a company
In the initial situation, our hypothetical company has revenues of €10 million and costs of €9.7 million. When revenue is increased by 3 percent, the variable costs increase as well: more raw material is required, for example, and both workers and machines need to work longer. The fixed costs – rents, insurances, and so forth – do not change.
Let’s assume the company has 70 percent variable costs and 30 percent fixed costs. When revenue is increased by 3 percent, or €300,000, the variable costs increase by 3 percent as well, for a total cost of (€9,700,000 + [€9,700,000 x 70% x 3%]) = €9,903,700. Thus profit increases by 32.1 percent.
On the other hand, if the company reduces purchasing costs by 3 percent, which we assume account for 50 percent of total costs in this example, the new costs are: (€9,700,000 – [€9,700,000 × 50% × 3%]) = €9,554,500. This results in a profit increase of 48.5 percent.
An increase of revenue by 3 percent in this situation has less influence on the profit than a cost reduction of 3 percent. A total cost reduction of that size can also be achieved through optimising indirect spend.
Spend analysis is a quick and effective way of identifying improvement potential
The amount of total indirect spend varies according to the industry the company is active in. On average, indirect spend accounts for 13.5 percent to 22 percent of revenue, depending on the industry.[2] Despite its significant size, we often find that management has limited visibility into indirect spend. Where this is the case, conducting a spend analysis enables the organisation to answer the following questions:
- Who is buying?
- What is being bought?
- From whom?
- When?
- At what price?
- And where (optionally)?
Indirect spend is often spread over thousands of suppliers, adding an additional layer of complexity. A high number of suppliers results in the need to manage a high number of different payment terms, which are usually not aligned. As an example to give an idea of the complexity, in a former project with a big European manufacturer with revenues in excess of €0.76 million ($1 billion), the indirect spend of €590 million ($779 million) was spread over 5,100 suppliers. Compared with the peer group, world-class companies have a significantly lower number of suppliers to deal with, in some categories more than 50 percent fewer.
To understand the current spend profile to determine the most relevant sourcing opportunities, companies conduct a spend analysis. But even finding out what a company is buying from suppliers is not always easy to investigate. In fact, in order to understand what was being bought in the period analysed, companies sometimes have to request management reports from suppliers. One reason for that is unclear responsibility. Inbound and outbound logistics can be covered by different departments, which makes categorising logistic providers difficult.
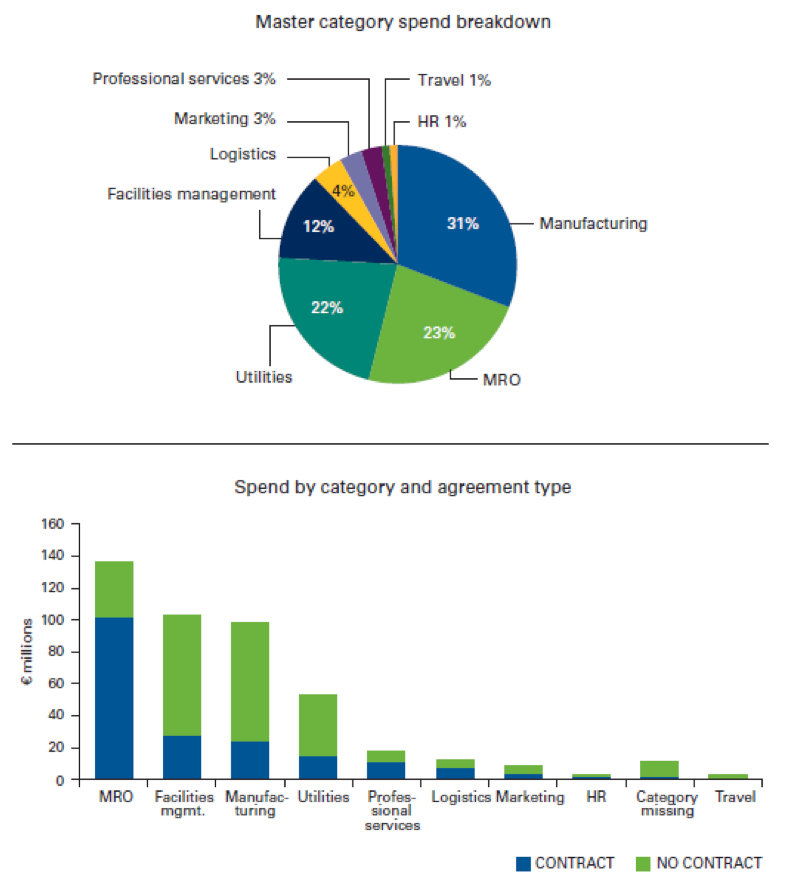
The starting point is data from the enterprise resource planning (ERP) system, but in most cases the information provided by the ERP system is not sufficient, and manual rework is necessary. Using a supplier segmentation can help the organisation determine the nature of wide groups of vendors, from strategic to sensitive. Part of the analysis should also investigate which suppliers your company has contractual agreements with and when they expire. In the following example, roughly 30 percent of indirect spend was contracted, but that number varied among spend categories. Segmenting your suppliers according to a companywide standardised classification scheme will give you a good overview of the distribution of your indirect spend (see Figure 2).
Now that you’ve got an idea of the kind of data necessary to conducting a thorough indirect spend analysis, be sure to check out part two of the series where I’ll examine how to turn the insights gleaned from this data your advantage.
REL can be found on twitter @RELConsultancy